They say a picture paints a thousand words, so let’s take a look at the latest market stats for the Perth market.
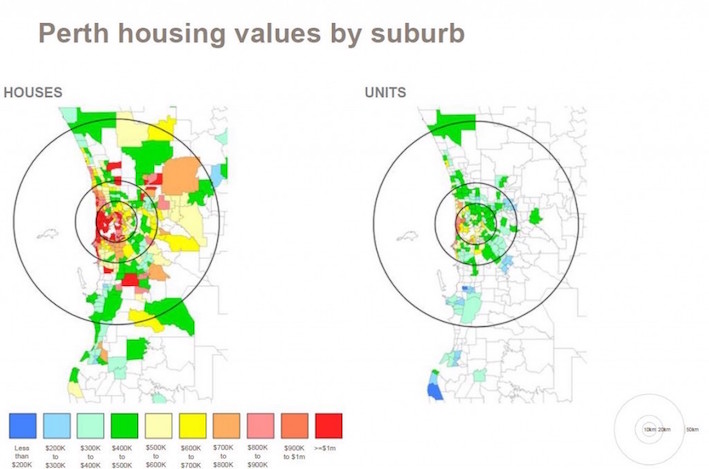
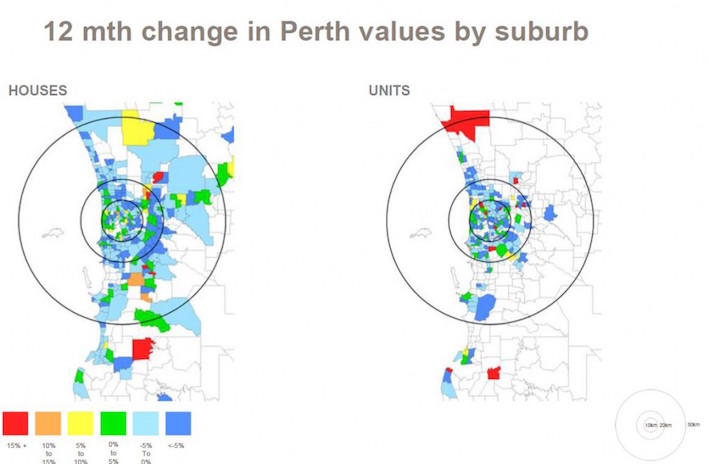
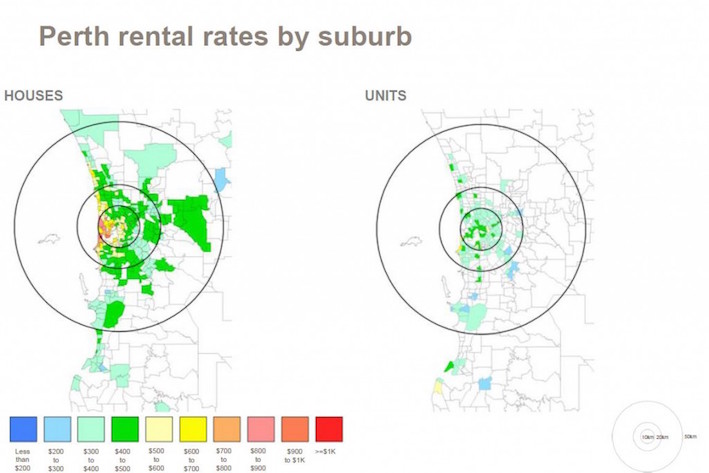
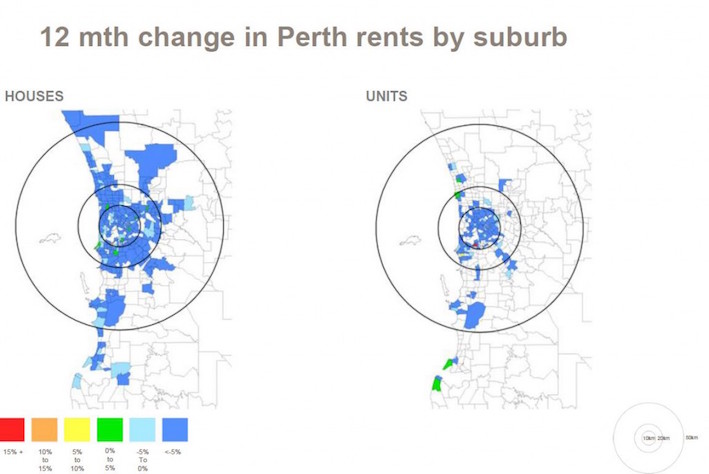
The Mapping the Market Report is a series of thematic maps highlighting the following stats for houses and units:
- Median values
- 12-month change in median values
- Median rental rates
- 12-month change in median rental rates
Across the combined capital cities, dwelling values have increased by 6.4% over the 12 months to March 2016 (which is their slowest annual rate of growth in 31 months).
Rental rates on the other hand, have fallen by -0.2% across the combined capital cities over the past year and this is the first time on record that rental rates have fallen on an annual basis.
The common theme across the individual capital cities is that home values and rental rates are in most instances more expensive the closer you get to the city and more affordable as you move further away from the CBD.
All data included in the following graphs is displayed at a suburb level. Where there is no colouring on the maps this indicates there were not enough sale or rental observations to calculate statistically reliable figures.


For the latest property market info, visit the blog section of the Naked Edge Real Estate website.


.png&w=70&h=70&zc=1&q=70&a=c)


