The CoreLogic Pain & Gain Report for the March Quarter has been released today and it has revealed that 14.8% of resold houses and 23.2% of resold units across Perth in the March Quarter took a loss, selling for less than the original purchase price. This is at its highest level since September 1997. The highest losses were experienced in Perth (40.0%), Murray (29.7%) and Mandurah (29.5%), whilst Gosnells (8.6%) and Melville (6.8%) experienced the least, and Peppermint Grove Council did not have any resales during the quarter.
Looking nationally, 9.2% of all homes sold recorded a loss, which was higher than the 8.8% 12 months ago. Of course, if 9.2% of homes sold at a loss, then 90.8% of homes recorded a profit, and of this 90.8%, 31.9% sold for more than double their purchase price.
As always, property ownership whether it be for yourself and your family, or as an investment, should be for the long term and very rarely is there a quick buck to be made in the property game. For more information on how this directly effects your market, contact a Naked Agent today.
Pain and Gain March Quarter, 2016
A quarterly assessment of realised gross profit and loss based on dwelling re-sales over the March Quarter of 2016
Executive Summary
The Pain and Gain Report is a quarterly analysis of homes which were resold over the quarter. It compares the most recent sale price to the previous sale price in order to determine whether the property sold at a gross profit or gross loss. It provides a proxy for the performance of each housing market and highlights the magnitude of profit or loss the typical seller of a home makes across those regions analysed.
Over the March 2016 quarter, 9.2% of all homes resold recorded a gross loss when compared to their previous purchase price. This figure was higher than the 8.3% at the end of 2015 and also higher than the 8.8% recorded 12 months ago. Across those dwellings which resold at a loss over the quarter, the total value of loss was $362 million with an average loss of $66,073.
While 9.2% of resales were transacted at a loss, the vast majority (90.8%) of properties resold over the quarter did so at a profit. In fact, nearly one third (31.9%) of homes resold for more than double their previous purchase price. Across those homes which resold at a profit, the total value of this profit was recorded at $12.9 billion with the average gross profit recorded at $239,855.
The data also highlights the fact that ownership of property, whether for investment or owner occupier purposes, should be seen as a long-term investment. Across the country, those homes that resold at a loss had an average length of ownership of 6.2 years. Across all sales recording a gross profit the average length of ownership was recorded at 10.2 years, while homes which sold for more than double their previous purchase price were owned for an average of 17.5 years.
The capital city housing markets continue to record a lower proportion of loss-making resales than regional areas of the country. The trends in regional areas are shifting with the proportion of loss-making resales trending lower in areas linked to tourism and lifestyle. On the other hand, housing markets linked to the resources sector are generally seeing an elevated level of loss-making resales after housing market conditions in many of these locations have posted a sharp correction, although the trend in loss making sales is now improving in many of these locations.
National Overview
Across Australia, 9.2% of all home resales over the March 2016 quarter transacted at a gross loss. Over the final quarter of 2015, 8.3% of home resales were at a loss which indicates loss making sales have risen over the most recent quarter. Despite the recent increase in the proportion of loss-making resales, less than 1 in 10 home sales are at a price lower than the previous purchase price.
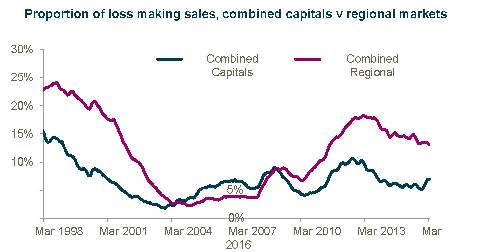
Capital city homes are much less likely to resell at a loss than those in regional Australia. Over the first quarter of 2016, 6.9% of capital city properties resold at a loss compared to 13.1% of regional properties. Over the past quarter, the proportion of loss making resales has increased from 5.6% at the end of 2015 across the combined capital cities and fallen from 13.4% in regional markets. In fact, regional areas of the country have just recorded their lowest proportion of loss-making resales since the three months to July 2011.
Capital cities have consistently recorded a lower proportion of loss-making resales than regional markets since the three months to March 2009. The recent improvement in housing market conditions across the larger regional housing markets is driving the proportion of loss-making resales lower.
Focusing on the average length of ownership for homes sold over the quarter, once again there are some differences between capital city and regional markets. Across the combined capital cities, homes that sold at a loss over the quarter had been owned for an average of 5.4 years compared to 10.1 years for homes sold at a gain and 17.2 years for those homes which sold for more than double their previous purchase price. The combined regional markets recorded a 6.8 year average for homes resold at a loss over the quarter compared to a 10.2 year average for homes sold at a gain and 18.1 years for homes sold for more than double their previous purchase price.
Nationally there was $361.0 million in realised losses over the quarter at an average of $66,073 and $12.9 billion in realised profit at an average of $239,855. Across the capital cities, there were $187.0 million in losses with an average of $72,042 per loss-making resale compared to $10.2 billion in profit at an average of $294,045. The combined regional areas recorded $174.7 million in losses at an average of $60,689 compared to $2.7 billion in profit at an average of $140,992. The average losses were greater in the capital cities, however they also generally experienced much greater profits, more than double those in regional areas.
The performance of resales of houses and units differs quite significantly across the combined capital cities and the combined regional areas of the country.
The proportion of both house and unit loss-making resales across the combined capital cities has trended higher over the past quarter across the combined capital cities. Over the quarter, 5.8% of house resales and 9.4% of unit resales were at a price lower than the previous purchase price. The data shows that historically capital city houses are much more likely to resell for a profit than units. In fact, there has been no period over which the proportion of loss-making resales was higher for houses than it was for units.
Over the first quarter of 2016, there was $120,007,898 in realised losses for resales of capital city houses and $67,012,830 in realised losses for units. The average loss was recorded at $81,694 for houses and $45,618 for units. In comparison there was $7,897,690,089 in realised resale profit for houses at an average of $330,447. For capital city units, the total profit was $2,329,180,744 at an average of $97,455.
Over the March 2016 quarter, 11.2% of combined regional market houses and 19.2% of units resold for less than their previous purchase price. Much like the capital cities, across the regional markets units have consistently recorded a higher proportion of loss-making resales than houses.
In terms of the value of these resales, there was $106,886,172 in resales losses over the quarter for regional houses and $67,777,822 in resale losses for units. The average losses were recorded at $57,808 for houses and $36,656 for units. The average profit on resales in regional markets over the quarter were $151,534 for houses and $30,918 for units. The total value of these resale profits were $2,232,397,879 for houses and $455,479,480.
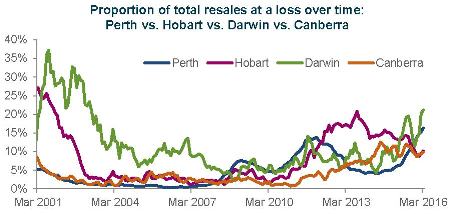
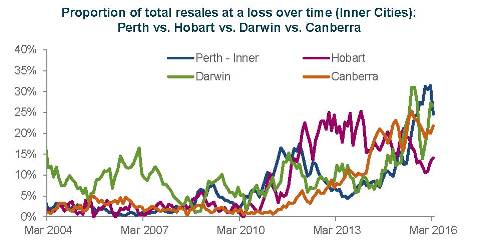
The proportion of loss-making resales has increased across each capital city over the most recent three months. While the proportion of loss-making resales has risen, on an historic basis most cities are still seeing quite a low instance of homes reselling at a loss. Perth and Darwin are the exceptions, seeing high proportions of loss-making resales. In Perth, 16.3% of homes resold at a loss the highest proportion since September 1997 and in Darwin 21.1% of homes resold at a loss, the highest proportion since April 2003.
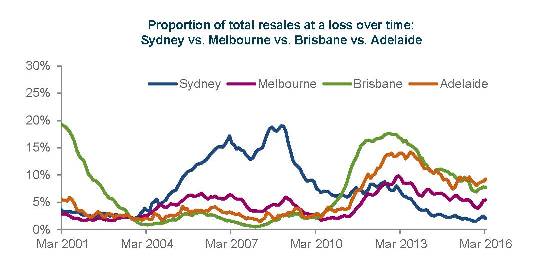
The proportion of loss-making resales over the March 2016 quarter across each capital city was recorded at: 2.1% in Sydney, 5.5% in Melbourne, 7.7% in Brisbane, 9.3% in Adelaide, 16.3% in Perth, 10.2% in Hobart, 21.1% in Darwin and 9.8% in Canberra.
Looking at the regional housing markets, the trends are somewhat different with most regional areas having seen the proportion of loss-making resales falling over the quarter. In fact regional Tasmania and regional Northern Territory are the only regions where loss-making resales increased over the quarter. Regional NSW loss-making resales are at their lowest level since February 2008, in regional Victoria they are at their lowest level since May 2012 and in regional Queensland they are at their lowest level since April 2011. These figures highlight the recovery in many of the larger regional cities currently underway.
The unit market has been gaining a lot of attention lately because of the record-high level of new construction; in this section we look at the proportion of loss-making resales across the inner city SA4 region unit markets across each capital city. As you will note, the proportion of loss-making resales is generally rising in these regions and much higher than those for houses in the same region.
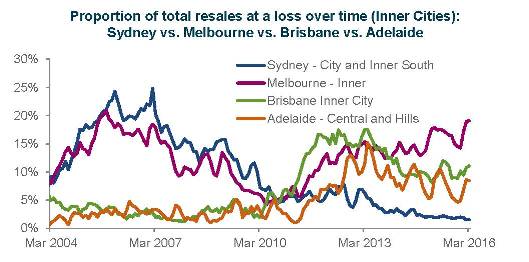
Over the quarter, 1.6% of resales were at a loss in Sydney-Inner City and South, across the other cities the regions recorded resale losses for units as follows: Melbourne-Inner (19.1%), Brisbane Inner City (11.1%), Adelaide-Central and Hills (8.4%), Perth-Inner (24.6%), Hobart (14.1%), Darwin (26.6%) and Canberra (21.8%). Melbourne-Inner has just recorded its highest proportion of loss making resales for units since November 2005. Sydney-City and Inner South and Perth-Inner are the only two regions where the proportion of loss-making unit resales have fallen over the quarter. Importantly, all regions analysed except for Sydney-Inner and South and Adelaide-Central and Hills are recording more than 1 in 10 unit resales at a loss. This is obviously a potential cause for concern with most of these regions expecting to see significant additional supply entering the market over the coming years.
Houses vs Units
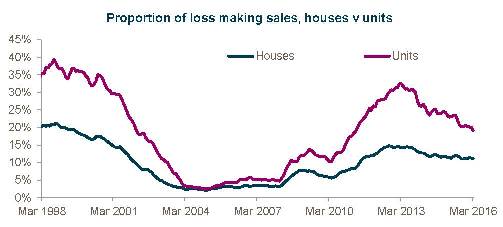
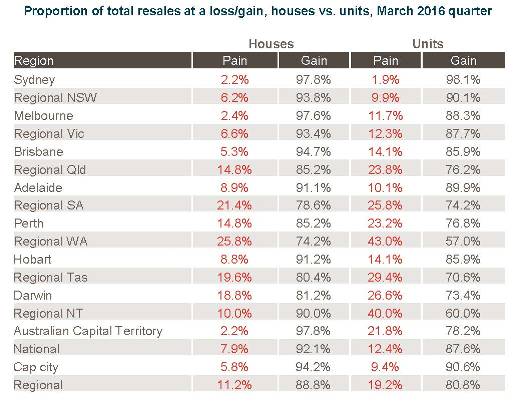
Over the first quarter of 2016, 7.9% of houses which resold transacted for less than their previous purchase price compared to 12.4% of unit resales. Across the capital cities, 5.8% of houses resold at a loss compared to 9.4% of units and in regional markets 11.2% of houses resold at a loss compared to 19.2% of units. The data already analysed shows that units are more likely to be resold at a loss than houses and the value of resale profits are typically significantly lower than those from houses.
Sydney was the only capital city or regional housing market in which units had a lower proportion of resales at a loss (1.9%) than houses (2.2%) over the quarter. The differential in loss-making resales between houses and units was quite substantial across most regions, in fact in Melbourne, Brisbane, Regional Northern Territory and the Australian Capital Territory units were more than twice as likely to resell at a loss as houses. The relatively higher proportion of loss-making resales for units is reflective of the fact that house values have historically increase at a more rapid pace than units. Furthermore, it also reflects the fact that units are much more likely to be owned by investors than owner occupiers. The ability for investors to offset losses against future capital gains while owner occupiers can’t means that investors are more likely and better able to deal with losses on resales of residential properties than owner occupiers.
Investor vs Owner Occupied Resales
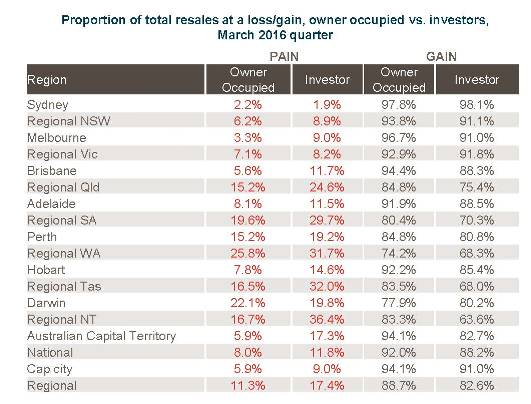
Over the first quarter of 2016, 8.0% of owner occupiers and 11.8% of investors that resold their properties did so at a loss. Sydney and Darwin were the only two regions in which the proportion of loss-making resales by investors was lower than those to owner occupiers.
For the combined capital cities, 5.9% of owner occupier resales were at a loss compared to 9.0% of investor resales. Investors were more than twice as likely to make a loss on resale as owner occupiers over the quarter in Melbourne, Brisbane and the Australian Capital Territory.
The proportion of loss making resales were much higher in regional markets at 11.3% of all resales for owner occupiers and 17.4% for investors. Those investors reselling in Regional northern Territory were more than twice as likely to incur a loss as owner occupiers.
Housing finance data has showed a sharp slowdown in investor activity over recent months. When it comes time to resell a property owner occupier stock is much more likely to turn a gross profit than investment stock. This is most likely due to the fact that investment is more prevalent in the unit market than detached houses. As we’ve already shown, units are more likely to be resold at a loss than houses are. Furthermore, investor housing stock generally has more narrow overall appeal than owner occupier housing stock. Arguably, transacting at a gross loss is easier for an investor to accept, as the loss can be offset against future capital gains. The recent heightened level of investment purchasing therefore poses risks in the event of a housing market downturn as investors may be willing to sell their investment but they may find it increasingly difficult to find willing purchasers.
Hold Periods
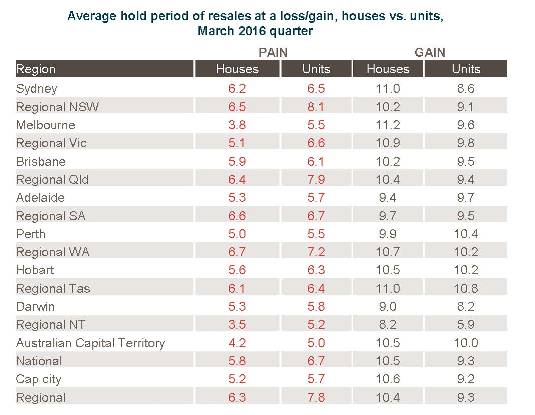
Over the first quarter of 2016, the typical house which resold for less than the previous purchase price had been owned for 5.8 years while the typical unit had been owned for 6.7 years. Turning to resales which made a profit, the typical length of ownership was 10.5 years for houses and 10.0 years for units.
Across the combined capital cities, the average length of ownership for loss-making resales was 5.2 years for houses and 5.7 years for units compared to 10.6 years and 9.2 years respectively for resales at a profit. Across each individual capital city, the average length of ownership for loss-making resales was shorter for houses than for units. For properties reselling at a profit, Adelaide and Perth where the only cities in which the average length of ownership was greater for houses than units.
For the combined regional markets, the average length of ownership for those properties reselling at a loss was 6.3 years for houses and 7.8 years for units over the first quarter of 2016. Those homes resold at a profit had been owner for an average of 10.4 years for houses and 9.3 years for units. The data highlights that over the quarter, loss-making resales had typically been owned longer in regional areas than in capital city markets. This is reflective of comparatively weaker property value growth in regional markets over recent years than in capital cities. When it comes to reselling at a profit, the average length of ownership was similar across the capital cities and regional markets.
Focus on Regional Markets
Major mining regions
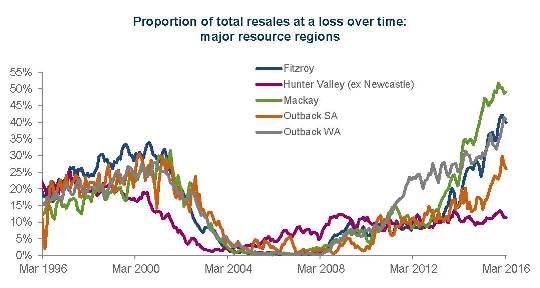
As the downturn in mining investment continues we continue to see fallout in certain housing markets, in fact the mining slowdown partly explains the current weakness in the Perth and Darwin housing markets. Across the major mining-linked regions nationally, over the first quarter of 2016 the proportion of loss making resales were recorded at: 39.9% of resales in Fitzroy, 11.3% in Hunter Valley (excluding Newcastle), 49.2% in Mackay, 26.0% in Outback SA, 40.9% in Townsville and 36.4% in Outback WA. Although the proportion of loss-making resales in most of these regions remains inflated, it actually fell over the quarter in Fitzroy, Hunter Valley (excluding Newcastle) and Mackay.
Across all regions except for the Hunter Valley (excluding Newcastle) the proportion of loss-making resales have recorded a significant rise over recent years. The rise in loss-making resales has been in line with the decline in resource investment and falling commodity prices. In many of these regions this has meant significantly less housing demand and subsequently value falls. In these regions many home owners wish to sell their homes, unfortunately there are very few willing buyers currently in these markets. As a result, those people selling are having to reduce their price expectations substantially in order to sell and in some instances simply can’t sell because there are very few people wanting to purchase in these regions.
Major Coastal Regions
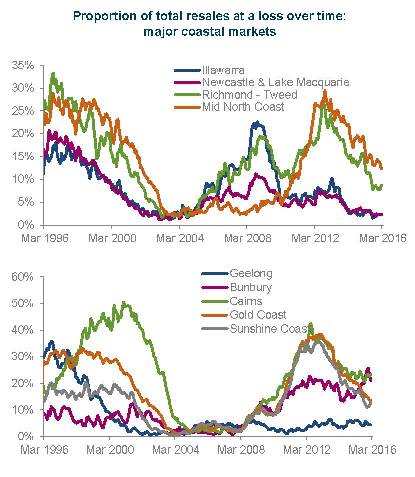
While the markets linked to the resources sector have seen their proportion of loss-making sales rise over recent years the coastal markets have generally seen conditions improve. Across the regions we analysed, the proportion of loss-making resales has been recorded at: 2.3% in Illawarra, 2.3% in Newcastle-Lake Macquarie, 7.7% in Richmond-Tweed, 11.0% in Mid-North Coast, 4.2% in Geelong, 21.8% in Bunbury, 22.8% in Cairns, 12.9% on the Gold Coast and 11.8% on the Sunshine Coast.
All of these regions are now showing a proportion of lossmaking resales which is lower than the recent peak. Bunbury and Cairns are the only regions where the proportion of lossmaking resales is higher than it was 12 months ago. The charts show that there has been a fairly sharp improvement in loss making resales over recent times in Richmond-Tweed, Mid-North Coast, Cairns, Gold Coast and Sunshine Coast. This is reflective of the returning value growth and overall improving housing market conditions in coastal lifestyle housing markets. The proportion of loss-making resales hasn’t been this low in many years across most of the regions detailed. With official interest rates having moved even lower and home value growth remaining steady we would expect a further decline in the proportion of loss-making resales over the coming quarters.
Unit dwellings within lifestyle markets are generally showing the largest proportion of loss-making re-sales
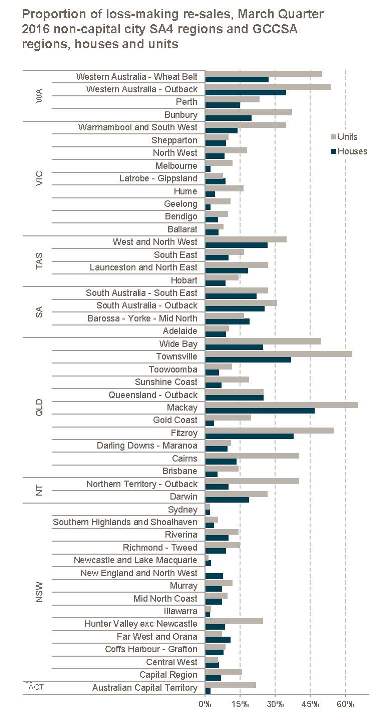
From a regional perspective the largest proportion of loss-making resales were located in the following regions:
- Mackay (Qld) (49.2%)
- Townsville (Qld) (40.9%
- Fitzroy (Qld) (39.9%)
- Outback (WA) (36.4%)
- Wide Bay (Qld) (28.2%)
- West and North West (Tas) (27.7%)
- Wheat Belt (WA) (27.3%)
- Outback (SA) (26.0%)
- Outback (Qld) (25.0%)
- Outback (NT) (22.9%)
The lowest proportion of lossmaking resales were recorded in the following regions:
- Sydney (NSW) (2.1%)
- Newcastle and Lake Macquarie (NSW) (2.3%)
- Illawarra (NSW) (2.3%)
- Southern Highlands and Shoalhaven (NSW) (3.9%)
- Geelong (Vic) (4.2%)
- Melbourne (Vic) (5.5%)
- Hume (Vic) (5.8%)
- Central West (NSW) (5.9%)
- Bendigo (Vic) (5.9%)
- Ballarat (Vic) (6.0%)
Pain & Gain Sydney council regions
2.2% of Sydney houses and 1.9% of units resold at a loss over the first quarter of 2016 with the proportion of loss-making resales remaining at near record lows. The Botany Bay, Hunters Hill and Mosman Council areas recorded no resales at a loss over the quarter. Even those council areas that recorded the highest proportion of loss-making resales: Strathfield (4.9%), Burwood and Bankstown and North Sydney (4.0%) recorded less than 1 in 20 resales at a loss over the quarter.
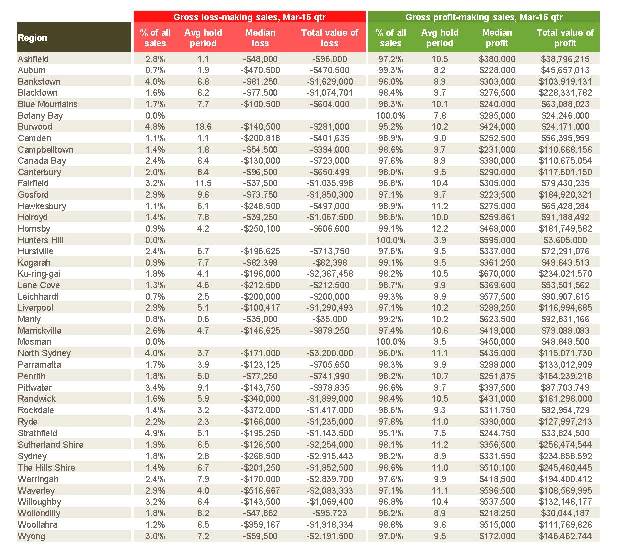
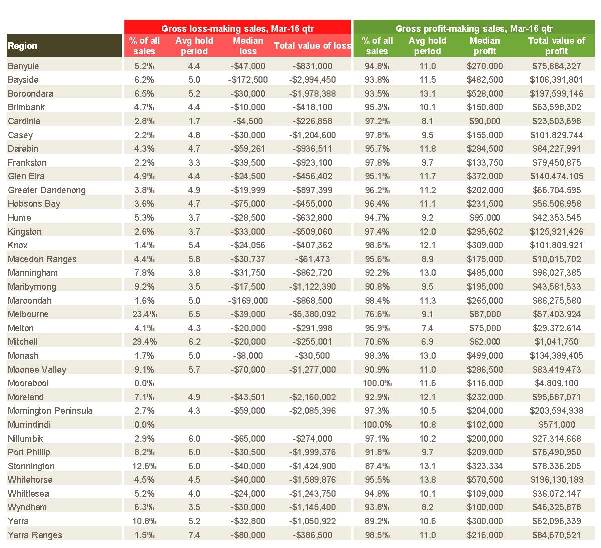
Pain & Gain Melbourne council regions
2.4% of Melbourne houses and 11.7% of units resold at a loss over the March 2016 quarter, with the proportion of loss-making unit sales at its highest level since March 2013. The Moorabool and Murrindindi council areas each recorded no resales at a loss over the quarter. The Mitchell (29.4%), Melbourne (23.4%) and Stonnington (12.6%) council areas recorded the highest proportion of loss-making resales over the quarter.
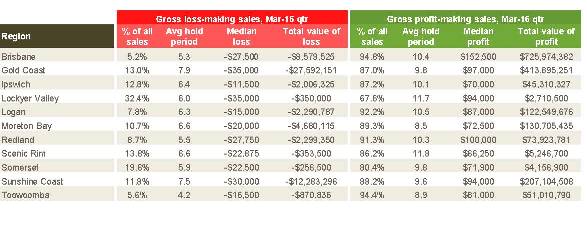
Pain & Gain South-East Queensland council regions
Across Greater Brisbane, the proportion of lossmaking resales has trended lower over the past few years and was recorded at 5.3% for houses and 14.1% for units over the March 2016. Looking more broadly at the South-East Queensland region, the council areas with the lowest proportion of loss-making resales were: Brisbane (5.2%), Toowoomba (5.6%) and Logan (7.8%). Meanwhile, the regions with the highest proportion of loss-making resales were: Lockyer Valley (32.4%), Somerset (19.6%) and Scenic Rim (13.8%).
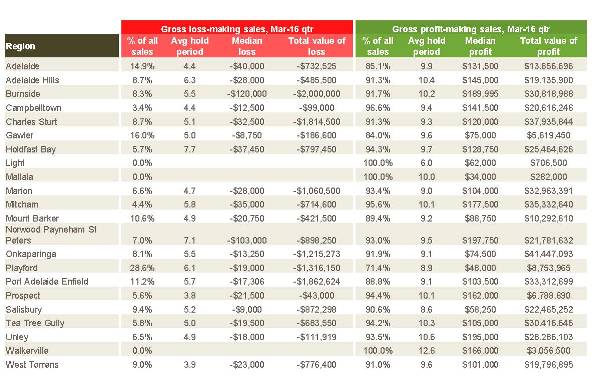
Pain & Gain Adelaide council regions
Over the March 2016 quarter, 8.9% of resales of Adelaide houses and 10.1% of units were at a gross loss, with both recording increases over the past quarter. The Light, Mallala and Walkerville council areas recorded no lossmaking resales over the quarter. The council areas with the highest proportion of loss-making resales over the quarter were: Playford (28.6%), Gawler (16.0%) and Adelaide (14.9%).
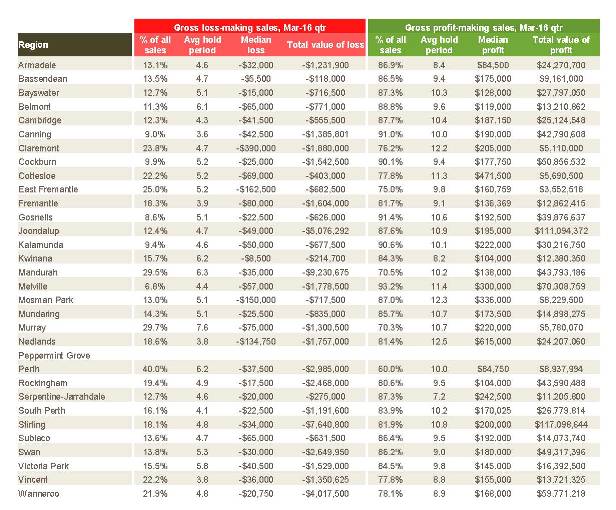
Pain & Gain Perth council regions
14.8% of resold houses and 23.2% of resold units across Perth over the March 2016 quarter were sold for less than the previous purchase price with loss-making resales of houses at their highest level since September 1997. The Peppermint Grove council area recorded no resales at a loss over the quarter, while Melville (6.8%) and Gosnells (8.6%) were the other two regions with the lowest proportion of loss-making resales. The highest proportion of loss-making resales occurred in the Perth (40.0%), Murray (29.7%) and Mandurah (29.5%) council areas.
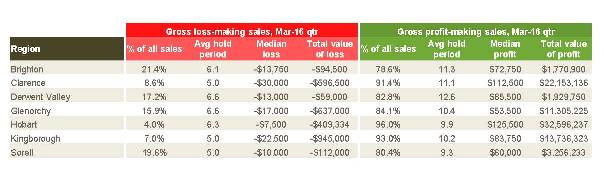
Pain & Gain Hobart council regions
8.8% of Hobart houses and 14.1% of units resold over the March 2016 quarter were at a loss, with both property types having recorded an increase over the quarter. Across the council areas, Brighton (21.4%), Sorell (19.6%) and Derwent Valley (17.2%) had the highest proportion of loss-making resales over the quarter. The proportion of loss-making resales was lowest in Hobart (4.0%), Kingborough (7.0%) and Clarence (8.6%) council areas.
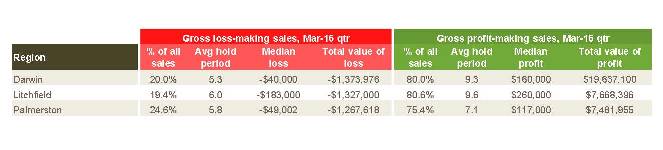
Pain & Gain Darwin council regions
Across Darwin over the three months to March 2016, 18.8% of houses and 26.6% of units resold at a loss both of which were much higher over the quarter and year. Palmerston has recorded the highest proportion of loss-making resales over the quarter (24.6%) followed by: Darwin (20.0%) and Litchfield (19.4%).
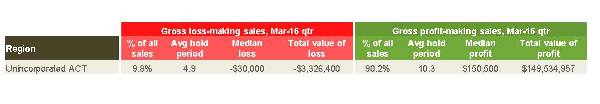
Pain & Gain Canberra council regions
Over the three months to March 2016, 2.2% of Canberra houses and 21.8% of units re-sold at a loss. While the proportion of loss-making resales of houses are at their lowest level in four years, loss making resales of units remain at around their highest levels since 2000.
To view the report in it’s entirety, head over to Core Logic’s Website.


.png&w=70&h=70&zc=1&q=70&a=c)