How does your savings (as a percentage of your income) compare with other Australians?
How do you compare to the rest of the world?
The Global Finance Magazine released an article earlier this year aggregating household savings rates across the world for 2015.
Household savings is “the difference between a household’s disposable income (wages, income of the self-employed and net property income) and its consumption (expenditures on goods and services).
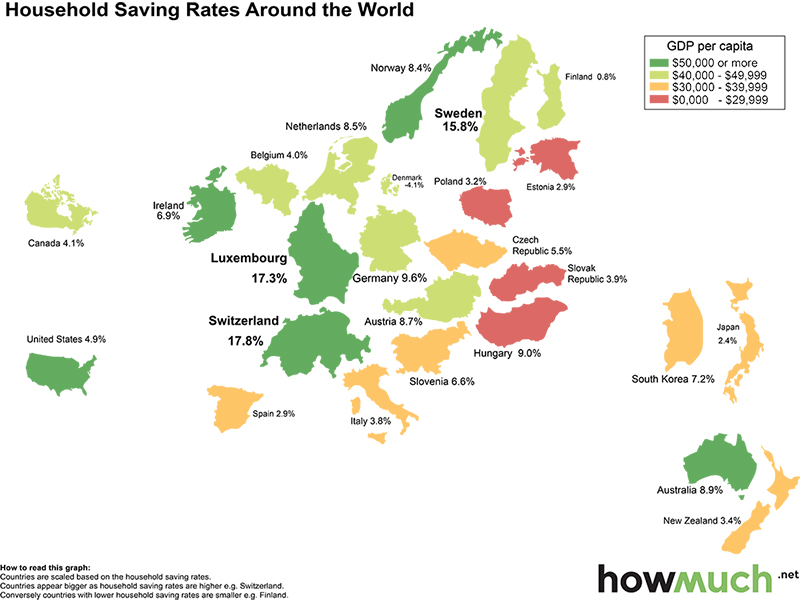
HowMuch.net built a map to provide a visualization of the household savings rates around the world by comparing 25 different countries.
The map size of the country is scaled based on the household savings rate.
Countries appear larger the greater the savings rate.
Countries are also coloured by their respective GDP per capita on a purchasing power parity (PPP) basis as provided by the Central Intelligence Agency’s World Factbook estimates.
Using the PPP exchange as defined by the International Monetary Fund (“the rate at which the currency of one country would have to be converted into that of another country to buy the same amount of goods and services in each country”) allows us to compare countries with different currencies.
Based on the data, the highest savings rate is 17.8% and the lowest is -4.1%.
Additionally, the highest GDP per capita is $102,900 and the lowest GDP per capita is $26,000.
Can you guess which countries saved the most and least?
Countries with the Highest Savings Rates
-
Switzerland: 17.82%
Luxembourg: 17.34%
Sweden: 15.83%
Germany: 9.55%
Hungary: 9.02%
Countries with the Highest GDP Per Capita
-
Luxembourg: $102,900
Norway: $68,400
Australia: $65,400
Switzerland: $59,300
United States: $56,300
Countries with the Lowest Savings Rates
-
Denmark: -4.06%
Finland: 0.82%
Japan: 2.42%
Spain: 2.88%
Estonia: 2.93%
Countries with the Lowest GDP Per Capita
-
Hungary: $26,000
Poland: $26,400
Estonia: $28,700
Slovak Republic: $29,500
Slovenia: $30,900
Higher GDP per capita does not mean a higher savings rate!
The data shows that having a higher GDP per capita does not necessarily mean a country will have a higher savings rate.
For instance, Hungary ($26,000 GDP per capita) has a higher savings rate than Norway, Australia, United States, and Ireland, all of which have more than double the GDP per capita of Hungary.
As a matter of fact, Switzerland, which has the highest savings rate of the 25 countries compared in our map, has nearly half the GDP per capita ($59,300) as the highest GDP per capita in our map, Luxembourg ($102,900).
Denmark, which has a GDP per capita of $45,800 even has a negative savings rate of -4.06%! As seen by the map and data, savings rates differ widely across continents.
How do you as an individual compare to your country’s savings rate?
Are you saving more than the average citizen?


.png&w=70&h=70&zc=1&q=70&a=c)