CoreLogic has today released their June Home Value Index Report outline the results of the five capital cities. It clearly provides more conclusive evidence of Australia’s 2 speed property market and why policy designed for Sydney and Melbourne doesn’t translate to the rest of the country. Perth has again been the weakest performing city at -3% whilst Sydney has been the front runner with +6.8% growth. Find out more in the below report.
MEDIA RELEASE:
CoreLogic – 1 July 2016
Two-tier housing market dynamic sees Sydney and Melbourne dwelling values continue to surge
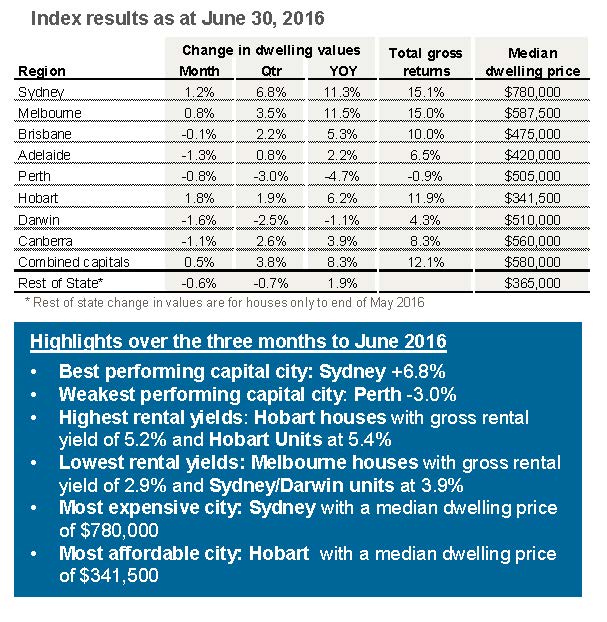
The CoreLogic June Home Value Index results reported a 0.5% rise in capital city dwelling values over the month with five capitals recording a fall in dwelling values while Sydney, Melbourne and Hobart values show another substantial rise.
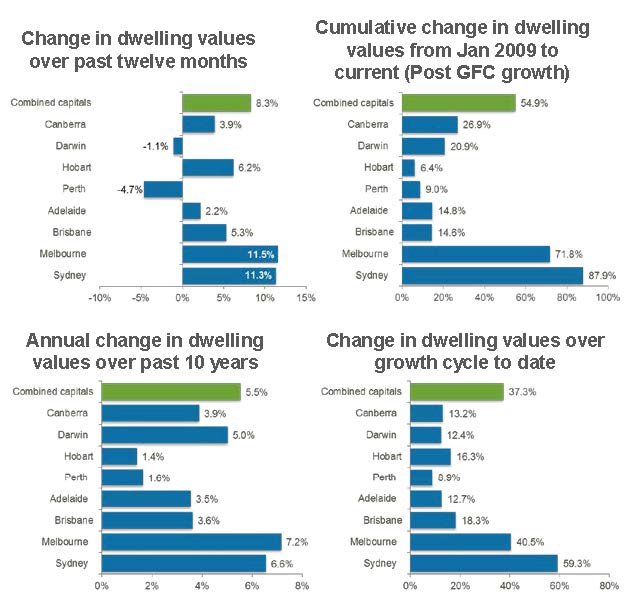
Higher dwelling values across Australia’s two largest capital cities continued to push the CoreLogic Hedonic Home Value Index to new record highs, with dwelling values across the combined capital cities rising by 0.5% in June to be 8.3% higher over the past twelve months.
The June results continued to show a rebound in housing market conditions after CoreLogic reported weaker results for the final quarter of 2015 when the combined capitals’ index was down 1.4%. CoreLogic Asia Pacific research director Tim Lawless said, “Importantly, the pace of capital gains in June was substantially lower than the April and May results when CoreLogic reported a 1.7%, and 1.6% month-on-month lift in capital city dwelling values.”
“The monthly growth rate reduction is likely to be very much welcomed by state and federal government policy makers and regulators who may be concerned about a sustained rebound in capital gains.”
“As an example, home values in Sydney have been rising for four years, and have increased by a cumulative 59% over this time frame. Melbourne dwelling values have been rising for the same length of time and have moved 41% higher over the growth cycle to date.”
“The combined capitals’ headline result was driven by a strong 1.2% rise in Sydney dwelling values, and a 0.8% gain across Melbourne’s housing market. Hobart values also showed strong conditions with dwelling values moving 1.8% higher over the month,” Mr Lawless said.
Although the headline results are positive, five of Australia’s eight capital cities recorded a decline in dwelling values in June. Monthly declines of more than 1% were recorded in Darwin (-1.6%), Adelaide (-1.3%) and Canberra (-1.1%), while the falls in Brisbane (-0.1%) and Perth (-0.8%) were less severe.
Mr Lawless said, “While the higher rates of capital gains in Sydney and Melbourne can be tied back to strong economic conditions, and high rates of population growth, the same cannot be said for Hobart where economic conditions and migration rates are gradually improving from a low base. The strength in the Hobart market comes after a long period of underperformance, where home values in the city increased by only 1.4% per annum over the past ten years. Potentially, the Hobart housing market is being fuelled by the sheer affordability of housing and a renewed trend towards Melbourne and Sydney buyers unlocking their equity to make lifestyle housing purchases.”
Based on the CoreLogic Index results over the first six months of the year, capital city dwelling values have moved 5.5% higher during 2016, with the most substantial capital gains located in Sydney (8.9%), Hobart (8.5%) and Melbourne (5.8%).
The only two capital cities to record a reduction in dwelling values for the year to date have been Perth and Darwin where home values have been drifting lower since 2014. Perth dwelling values have reduced by 3.9% over the first half of 2016, taking dwelling values 7.4% lower since the market peaked in December 2014. Darwin dwelling values are down by 0.2% over the first half of 2016 and have fallen by a cumulative 6.9% since the recent peak in May 2014.
Mr Lawless said, “Housing market conditions in both Perth and Darwin are suffering from reduced housing demand resulting from a sharp downturn in migration and weaker employment opportunities. Rental rates have also fallen substantially in both cities, highlighting that lower housing demand is not confined to home buyers but also renters.”
The latest update on overall housing market performance provides a timely view on dwelling value appreciation over the 2015/16 financial year. Capital city dwelling values have increased by 8.3% over the financial year which is lower than what was recorded over the previous two financial years when capital city dwelling values were 9.8% higher over 2014/15 and 10.1% higher in 2013/14. The recent peak rate of annual growth was recorded in July last year when capital city dwelling values were 11.1% higher over the preceding twelve month period.
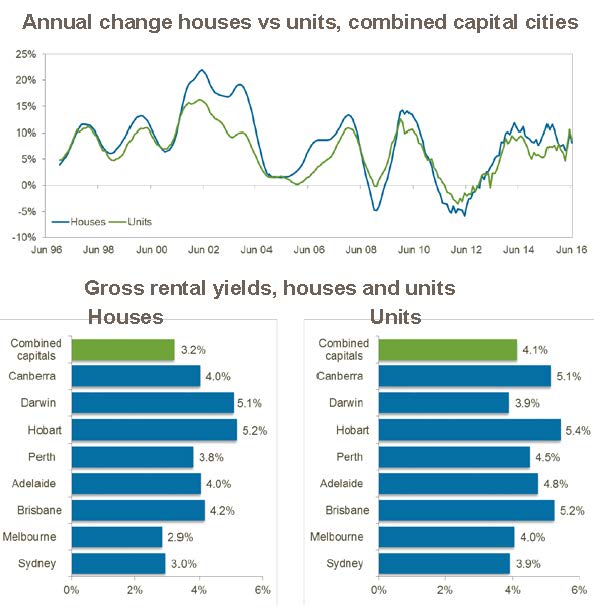
With capital city dwelling values moving higher, at least at a macro level, there has been some further slippage in gross rental yields. The average gross rental yield across the combined capital cities hasn’t been this low since the CoreLogic rental series commenced in 1996. The typical gross yield on a house is now averaging 3.2% and units are averaging 4.1%.
Rental yields are generally low across all of the capital cities, however, it is only in Sydney and Melbourne where yields for both houses and units have dropped to new record lows. Melbourne remains the lowest yielding market for houses, averaging 2.9%, whilst unit yields are now lowest in Sydney and Darwin, averaging 3.9%.
Mr Lawless said, “Despite low mortgage rate settings, the low yield profile implies that the majority of recent investors will be experiencing a cash flow loss on their property after expenses are taken into account.”
“Overall, the strong housing market conditions in Sydney and Melbourne are being reported in-line with high auction clearance rates and resilient levels of mortgage related activity and are also supported by a robust level of consumer confidence.”
Auction clearance rates have shown a noticeable improvement since December last year; Sydney clearance rates have been higher than 70% through most of 2016 to date, with the last two months seeing the success rate of Sydney auctions holding firm around the mid 70% range. Similarly, auction results in Melbourne have been tracking consistently in the low 70% to high 60% range week to week in 2016.
Additionally, the Westpac-Melbourne Institute measure of consumer sentiment remained in positive territory during June, after surging in May. Mr Lawless said, “The June reading was 7.2% higher than a year ago, indicating consumers remain relatively optimistic, however with the recent Brexit vote and ensuing global uncertainty, confidence levels are likely to reduce over the coming months which may impact on consumer willingness to enter into high commitment decisions like purchasing property.”
”Some positive news for Sydney buyers is that there are early signs that Sydney’s housing market may be starting to turn in favour of the buyer.”
“We’re seeing homes in the city taking longer to sell and vendors are starting to offer larger discounts on their asking prices in order to make a sale. The typical Sydney home is now taking 40 days to sell compared with 26 days a year ago and discounting rates have risen from 5.5% a year ago to 5.6%.”
“In balance, Australia’s two largest cities are facing increased affordability challenges that are likely to negatively impact the trajectory of dwelling values and activity as more prospective buyers are blocked from the market,” Mr Lawless said.
Recent median dwelling price to median household income ratios released by CoreLogic, using household income data from the Australian National University, show Sydney’s dwelling price to income ratio has reached 8.2, indicating that dwelling prices are 8.2 times higher than annual household incomes. Melbourne shows a healthier affordability index compared with Sydney, however, dwellings prices remain 6.8 times higher than household incomes.
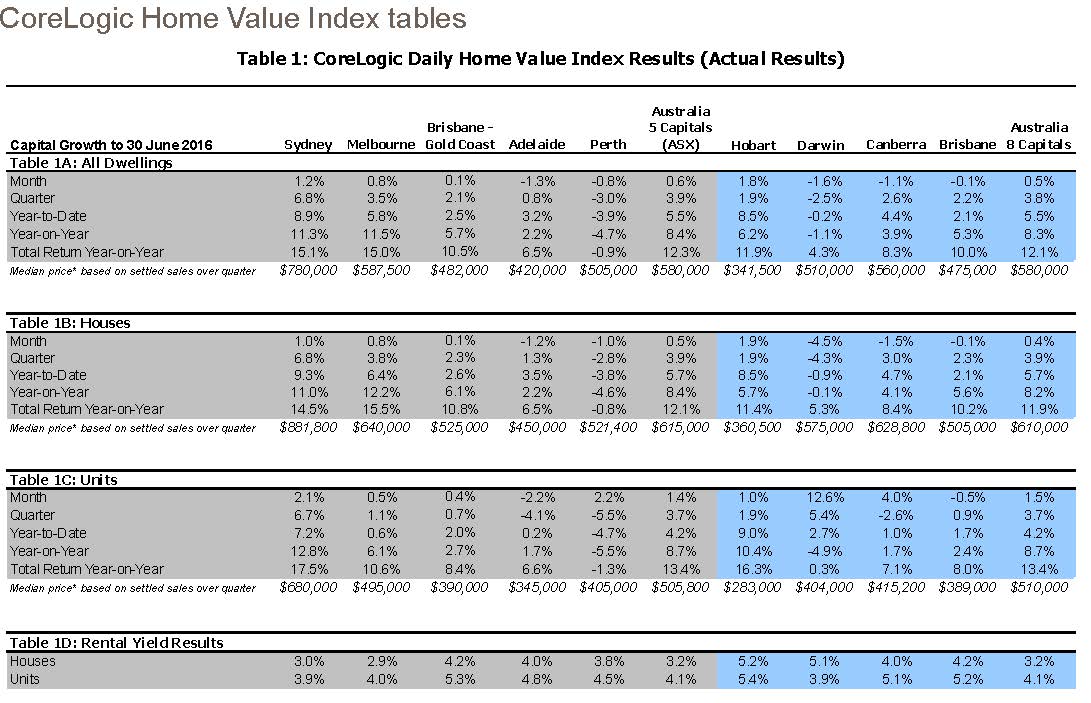
The indices in grey shading have been designed for trading environments in partnership with the Australian Securities Exchange (www.asx.com.au). Indices under blue shading (Hobart, Darwin, Canberra, Brisbane and the 8 capital city aggregate) are calculated under the same methodology however are not currently planned to be part of the trading environment.
*The median price is the middle price of all settled sales over the three months to the end of the final month. Median prices are provided as an indicator of what price a typical home sold for over the most recent quarter. The median price has no direct relationship with the CoreLogic Hedonic Index value. The change in the Index value over time reflects the underlying capital growth rates generated by residential property in the relevant region.
The CoreLogic Hedonic Index growth rates are not ordinarily influenced by capital expenditure on homes, compositional changes in the types of properties being transacted, or variations in the type and quality of new homes manufactured over time. The CoreLogic ‘index values’ are not, therefore, the same as the ‘median price’ sold during a given period. See the methodology below for further details.
Methodology: The CoreLogic Hedonic Home Value Index is calculated using a hedonic regression methodology that addresses the issue of compositional bias associated with median price and other measures. In simple terms, the index is calculated using recent sales data combined with information about the attributes of individual properties such as the number of bedrooms and bathrooms, land area and geographical context of the dwelling. By separating each property comprising the index into its various formational and locational attributes, differing observed sales values for each property can be separated into those associated with varying attributes and those resulting from changes in the underlying residential property market. Also, by understanding the value associated with each attribute of a given property, this methodology can be used to estimate the value of dwellings with known characteristics for which there is no recent sales price by observing the characteristics and sales prices of other dwellings which have recently transacted. It then follows that changes in the market value of the stock of residential property comprising an index can be accurately tracked through time. CoreLoguic owns and maintains Australia’s largest property related database in Australia which includes transaction data for every home sale within every state and territory. CoreLogic augments this data with recent sales advice from real estate industry professionals, listings information and attribute data collected from a variety of sources. For detailed methodological information please visit www.corelogic.com.au


.png&w=70&h=70&zc=1&q=70&a=c)